
A couple of years ago Spotify started their “year in review”/“wrapped” where they showed you a brief summary of what you’ve listened during the year. I have to admit that i think it’s pretty cool, and I always get excited when that time of the year comes around. Maybe more than I should…
From that moment on, I was hoping Netflix one day would do something similar, but with the movies and shows I watched during the year. But as Netflix didn’t seem to be interested in the idea, I decided to do it myself. But why just stop at Netflix? Why don’t I do build one with blackjack and hookers… I mean, with movies and shows I’ve watched on any platform?

Bender, the true inspiration for this project.
Preparing the dataset.
On January 1st, 2019, I started to track every move and show episode I watched. I did it with a very simple spreadsheet on Google Drive, where every time I watched something, I entered the date, if it was a movie or a show (I will use this information later), the title, on which platform I watched it, how much I liked it and the iMDB id.
No matter what time it was, where I was or how much did I feel like doing it, during the entire year I made sure that the spreadsheet was up to date. Victory number 1: being consistent.
If you want to see what my dataset looked like (or if you are curious about what I’ve watched), you can check it by clicking here; but don’t judge!
Deciding what to do with the dataset.
Now that I had all the data I needed, it was time to decide what kind of stats I wanted to obtain from this. Basing myself on Spotify and other ideas I had, this is what I ended up with:
- Time spent watching each movie and show genre.
- Average score for each genre.
- Time spent watching movies.
- Time spent watching shows.
- Time spent using each platform.
- Time spent watching each actor.
- Average score for each actor (based on the movie or episode score).
- Time spent watching each director.
- Average score for each director (based on the movie or episode score).
- Time spent watching each production company.
- Average score for each production company (based on the movie or episode score).
- Time spent watching movies or series each day of the week.
- Time spent watching movies or series each month.
- Favourite movie of the year.
- Favourite movie of all time.
- Favourite show of the year.
- Favourite show of all time.
Processing the dataset.
Obviously I wasn’t intending of calculating all of this stats by hand because I’m super lazy, so I used a couple of tools to automate this.
Watching habits tracker.
As I said before, fo this I used Google Sheets.
For a moment I migrated to a data base, but since I didn’t create an interface to access it remotely in a simple way, updating it was quite tedious, so I returned to Google Sheets, that was perfect for what I needed. Why use a nuclear bomb to kill an ant?
Movies and shows information.
Unfortunately, iMDB and Rotten Tomatoes don’t have a public API, and the cost of the licence was U$ 40,000, so no thanks… ?
However, there are plenty of open-source and collaborative options around, and I decided to use The Movie Database, which offered a lot of information for everything I needed through their API, images for the video I uploaded on Instagram, and also have an extremely clear documentation and a great community of developers, which was really helpful when I had doubts and questions.
Data processing and automation.
I created a Python script to fetch all the information needed from the TMDB API and make all the necessary calculations for the stats.
It’s code that probably doesn’t adhere to the highest standards or conventions, might have a few conceptual error architecture-wise and there might be more efficient ways to achieve what I wanted, but at the end of the day, it was pretty simple to write and worked perfectly, so… ?♂️. Again:
Why use a nuclear bomb to kill an ant?
Every college programming professor ever when giving a cuestionable answer on an exercise.
If you are interested, you can check out the code on GitHub, since I documented it as best as I could for anyone who wants to read it.
And now, I’ll leave you with what we all came here to see… hardcore nudity!
Nah, talking seriously now…
Results.
Series and movies watched.
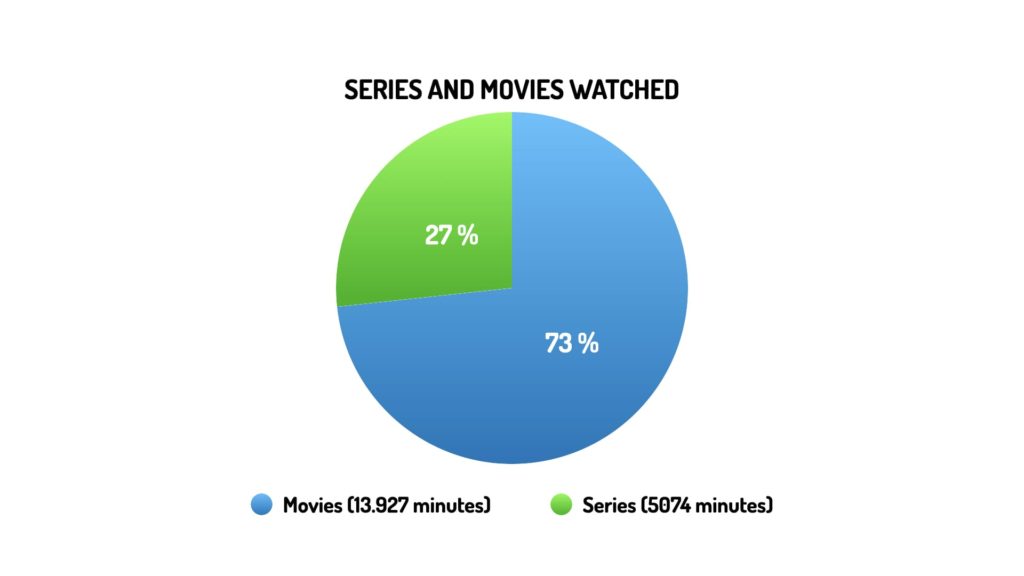
In total, I watched 19,001 minutes of movies and shows (or roughly 317 hours), of which 13,927 minutes were achieved by 118 movies, and 5074 minutes were achieved by 119 series episodes.
This year I didn’t really feel like watching shows or series. Generally, I looked for content that had a clear beginning and ending, that’s why the difference between movies and series is that large. Next year that will probably change, since Disney+ is scheduled to launch in my region, and there are plenty of shows that I’m really interested in.
Watching time by platform.
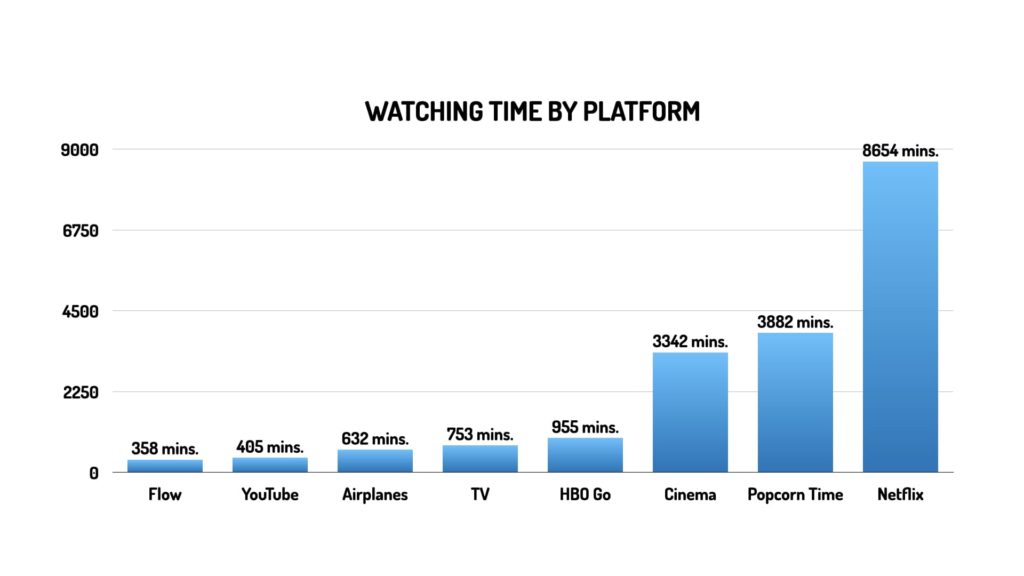
I felt that this was going to be more evenly distributed, but it seems Netflix has quite a lead with 8654 minutes.
Although I try to pirate as little as I can, Popcorn Time comes second with 3882 minutes; but It’s compensated by how much I go to the Cinema, with it’s 3342 minutes.
The more surprising fact is that I spent almost the same amount of time watching movies and show being on an airplane as on TV. Traditional media is dead with out generation.
Watching time by month.
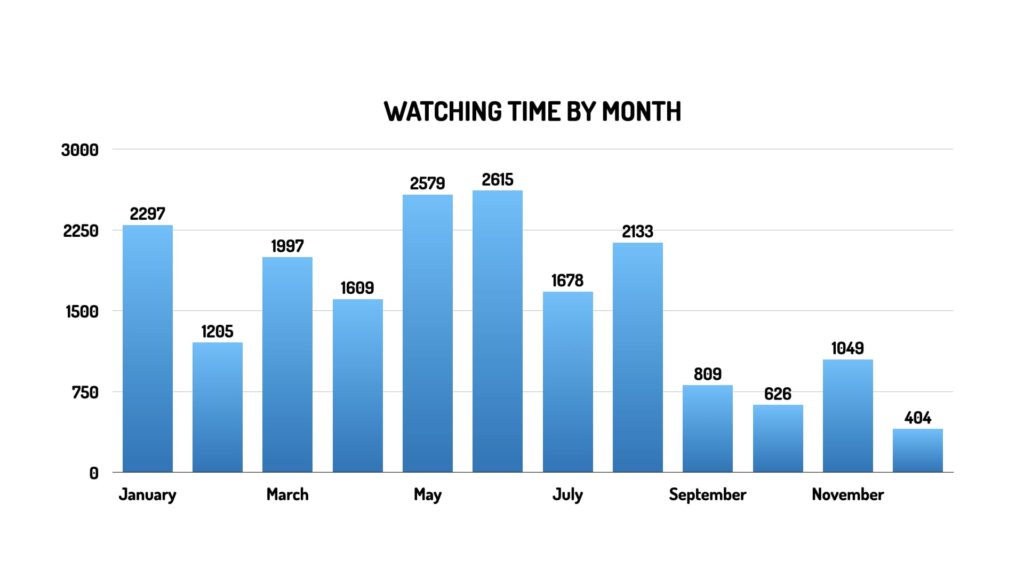
June was the month I spent the most time watching movies and series. That dip in September you may ask? It was due to the fact that my Netflix list empty, so it was harder for me to find something interesting to watch. Also, I use that time to catch up on my PS4 backlog and play some games that I have been wanting to play for a long time.
Watching time by day of the week.
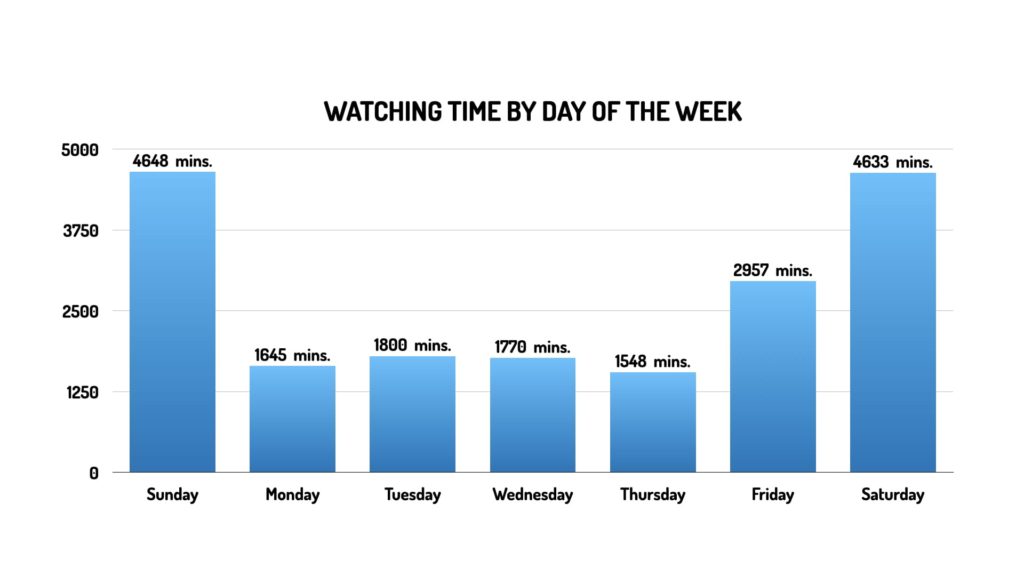
No surprises here. It was clear that weekdays were not going to be the top days since I spend a lot of time at the office. Friday rises up a bit since that is the day I usually go to the cinema, and, naturally, weekends are the most heavy days since I don’t have much to do and I use that opportunity to keep doing nothing, but in front of a screen ?.
Most watched genre.

- Drama: 8151 minutes.
- Action: 7110 minutes.
- Comedy: 5842 minutes.
- Adventure: 5495 minutes.
- Science Fiction: 4968 minutes.
- Thriller: 2788 minutes.
- Crime: 2590 minutes.
- Fantasy: 2491 minutes.
- Romance: 2370 minutes.
- Documentary: 1919 minutes.
- Musical: 1103 minutes.
For this ranking I’m considering that a movie or show can have more than one genre, and I counting it for all of them.
Most liked genre.

- Animatin: 4.43
- Science Fiction: 4.37
- Adventure: 4.22
- Action: 4.19
- Drama: 4.12
The nerd inside me is disappointed that Science Fiction isn’t at the top. Forgive me Stan Lee and George Lucas… I’ve failed you.
Most watched actors and actresses.

- Robert Downey Jr.: 1456 minutes.
- Scarlett Johansson: 1428 minutes.
- Chris Evans: 1332 minutes.
- Samuel L. Jackson: 1319 minutes.
- Chris Hemsworth: 1268 minutes.
The amount of minutes was taken by the duration of the movie or episode they have appeared in.
Obviously, after watching 50 hours of the Marvel Cinematic Universe, the ranking couldn’t be different ?♂️.
Most liked actors and actresses.

- Jared Harris: 4.9
Emily Watson: 4.9
Paul Ritter: 4.9
Jessie Buckley: 4.9
Adam Nagaitis: 4.9
Sam Troughton: 4.9
Robert Emms: 4.9
Con O’Neill: 4.9
Adrian Rawlins: 4.9 - Chadwick Boseman: 4.83
- Angus Cloud: 4.81
Eric Dane: 4.81
Alexa Demie: 4.81
Jacob Elordi: 4.81
Barbie Ferreria: 4.81
Nika King: 4.81
Storm Reid: 4.81
Hunter Schafer: 4.81 - Jeremy Renner: 4.8
- Benedict Cumberbatch: 4.7
The average scores are based on the score achieved by the movies and episodes they have appeared in.
On bold, actors and actresses from the MCU; on italic, actors and actresses from Chernobyl; in “regular” font, actors and actresses from Euphoria.
I don’t really like this stat. I’m kind of underwhelmed by it because it’s not very real. I have to re-think the way I’m obtaining this stat to make it more meaningful and to avoid simply listing the actors and actresses of a show or a movie saga.
Most watched directors.
- Joe & Anthony Russo: 794 minutes.
- Chad Stahelski: 354 minutes.
- Quentin Tarantino: 350 minutes.
- Dean DeBlois: 306 minutes.
- Joss Whedon: 284 minutes.
The Russo brothers, having directed Captain America: The Winter Soldier, Captain America: Civil War, Avengers: Infinity War y Avengers: Endgame (that I watched twice) are the clear winners. Chad Stahelski directed the John Wick saga. Quentin Tarantino only does 3 hour movies. Dean DeBlois is the director of the How to Train Your Dragon saga. And Joss Whedon barely sneaks in with Avengers and Avengers: Age of Ultron.
Most liked directors.
- Paul Dugdale (Taylor Swift’s Reputation Stadium Tour): 5.0
Joe & Anthony Russo (MCU): 5.0
Sam Levinson (Euphoria): 5.0 - Jeremy Webb (The Punisher): 4.75
- Dean DeBlois (How To Train Your Dragon): 4.67
- Joss Whedon (Avengers): 4.5
Jon Favreau (Iron man): 4.5
Mike Judge (Idiocracy, Silicon Valley): 4.5
Jamie Babbit (Silicon Valley): 4.5 - Ivan Reitman (Draft Day, No Strings Attached): 4.25
Peyton Reed (Ant Man): 4.25
Most watched production company.

- Marvel Studios: 3184 minutos.
- Marvel Television: 1365 minutos.
- Warner Bros. Pictures: 1313 minutos.
- Columbia Pictures: 1025 minutos.
- ABC Studios: 928 minutos.
3 of those 5 companies belong to Disney.
Most liked production company.
- Sister Pictures (Chernobyl): 4.9
The Mighty Mint (Chernobyl): 4.9
Word Games (Chernobyl): 4.9 - A24 (Euphoria): 4.81
- Tall Girls Productions (Jessica Jones): 4.62
- Ternion Pictures (Silicon Valley, Idiocracy): 4.47
- Marvel Television (The Punisher, Jessica Jones): 4.42
Favourite movie of the year.
The award goes to… Star Wars: The Rise of Skywalker
I have to admit that I cried a little (a lot) at the theater watching the saga end…
However, I think I might be affected by “Recency Bias”, which makes me consider something more relevant just because it happened more recently. For that reason, I will share the award with…
Avengers: Endgame. DUH!
Favourite movie of all time.
Unbelievably, I think that my favourite movie of all time is not any Star Wars or Marvel movie (shocking, I know), but rather is Miss Sloane, a political thriller that I admit is an inspiration for the kind of ruthless strategist I aspire to be at work (or in other words: super harsh and maybe a little bit unstable, but someone who gets s#!t done)
Favourite show of the year.

Euphoria. Chernobyl is a close second, but Euphoria’s story and characters really interest me. Also… Zendaya. Do I need to say anything else?
Favourite show of all time.

House. How I Met Your Mother is a close second. Those are the first shows I remember waiting every week for a new episode.
Conclusions and next steps.
My taste is all over the place. From Sci-Fi and Action, going through Romantic Comedies, ending in Documentaries. I’m happy to say that I’m not stuck in a particular genre and I’m open to almost anything (I’m sorry horror movies, you are still a “No No”).
This was a fun project and a great excuse to do something that involved my coding skills outside of work. Next year I’ll probably do it again, trying to improve certain stats, using new ones and probable with less protagoinsm of Marvel stuff, which will probably make it more diverse.


Comments by Nacho